Polio cases · 1980
BEHIND THE EXPERIENCE
National totals come from the existing polio dashboard dataset (the case_counts.json series used by Polio’s Last Mile). National 3-dose polio vaccine coverage comes from the dashboard’s WHO/UNICEF WUENIC series; it is not allocated to regions. Regional figures are seeded randomized simulations, not observed regional case counts or statistical regional estimates. Random weights vary by year; largest-remainder rounding makes every year’s regional integers sum exactly to the observed national total. The seed is fixed so reloading does not change the result. This visualization does not show local outbreaks, regional risk, or evidence of regional trends.
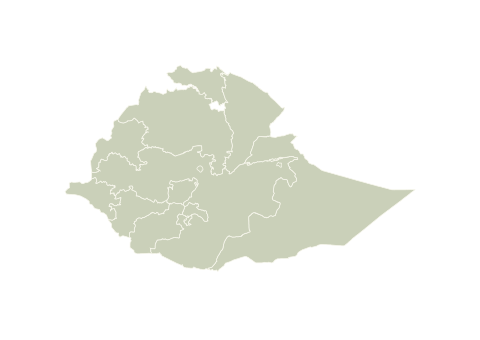
The map shows 12 regional states and two city administrations: Addis Ababa and Dire Dawa. English display names follow the Ministry of Health’s Health Sector Development and Investment Plan (2023/24–2025/26). Southern Ethiopia is also known as South Ethiopia. The map uses today’s administrative areas for all historical simulations, not historical boundaries.
All years shown use the Gregorian calendar, not the Ethiopian calendar. The timeline includes only the 36 years with an available Ethiopian case observation. Missing years are not treated as zero. The chart places observations at their actual calendar years; the slider steps between available observations. Columns rise from the real landscape using a fixed, linear height scale across every year. They are placed at regional representative points, not at case locations. A region allocated zero cases has no column. Column height encodes case count; terrain height encodes measured elevation with the stated exaggeration. Counts are not population-adjusted rates. Historical simulations use today’s region definitions. The randomized pattern is independent of population.
K means thousand and M means million. Population figures are rounded for readability; hover over a total for its full value. Screen readers receive the full count. Polio case counts are shown in full. Animation is decorative; it does not indicate incoming cases or live data.
This view uses WorldPop R2025A v1, 2025 UN-adjusted constrained 1km age-sex grids. Population sums all both-sex age groups. These are modeled population estimates, not census counts. Regional aggregation assigns each grid-cell center to the displayed boundaries, giving smaller administrations precedence in overlaps. Cells outside those boundaries are not redistributed: the national raster totals can therefore exceed the sum of mapped regions. Historical polio years do not change these 2025 snapshots. WorldPop / University of Southampton, CC BY 4.0.
Measured terrain from Mapzen Terrain Tiles is sampled into a lightweight mesh. Elevation is exaggerated 24× for readability; it is not survey precision. Regional outlines derive from the repository’s simplified OCHA boundaries; contested ET99 is omitted and small overlapping areas are resolved in the v2 model.
The landscape uses a fixed 2021 Sentinel satellite composite from ESA WorldCover. It does not change with the case year. Lakes & rivers highlights WorldCover permanent water and generalized Natural Earth rivers. It is a geographic overlay, not a flooding or water-access model.
© ESA WorldCover project 2021 / Contains modified Copernicus Sentinel data (2021), processed by ESA WorldCover consortium. CC BY 4.0. Terrain attribution: USGS SRTM, GMTED and other Mapzen source datasets. Natural Earth: public domain.
Mountains, valleys and waterways shape the distances between communities. Lift a region, turn the landscape, and discover a different view of Ethiopia.
Drag the map to rotate; scroll or pinch to zoom. Click a region to lift and highlight it. Dragging rotates the whole map; regions stay in their geographic position. Focus the map and use arrow keys to rotate or tilt; Home resets the angle. Use the region selector, year slider and zoom buttons for keyboard access. Escape closes this panel. Reduced-motion preferences are respected.